 When we think of the role of advancing technology in prosthetic care, we tend to think of advances in individual components such as external power, microprocessor regulation, and pattern recognition. However, there is another technology track weaving its way into prosthetic rehabilitation that requires the full attention of the profession. Though the movement has left footprints in the academic literature to mark its progress, its formal arrival on the scene was heralded in an Announcement to the Field by Joseph Miller PhD, CP, U.S. Department of Veterans Affairs (VA) national program director, orthotics and prosthetics clinical services.
In the announcement, dated April 3, 2015, Miller states the need for the provision and use of utilization monitors.1 Expressed succinctly, “the implementation of monitoring and utilization devices was in response to concerns from the OIG [Office of Inspector General] whether veterans were actually using the devices that they were receiving through the VA.”
So begins an era in which patient-reported activity may no longer be enough to substantiate the individual’s utilization of his or her prosthesis. According to the VA announcement, outcome monitoring and utilization devices must be able to record the following:1
As this program goes into effect at a VA hospital near you, there will be tremendous value in knowing the objectively recorded and reported activity rates of comparable technologies in the literature that led to this formal announcement. The news is neither all good nor all bad, but we need to prepare ourselves to understand that the activity rates that patients perceive and report do not always match the activity rates they actually experience.
Initial Signs of Discord
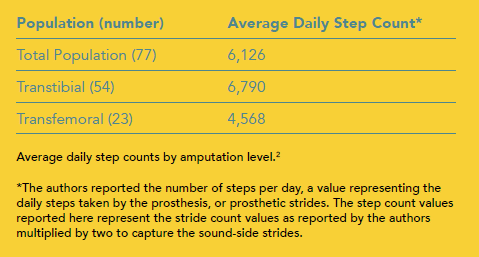
The first clinical trial to compare the congruence between self-reported and objective measurements of activity levels in people with lower-limb amputations was published in 2007. The trial consisted of 77 community-dwelling patients with unilateral lower-limb amputations who had at least six months of experience using their current prostheses. The cohort had a mean age of 60 years; roughly three-quarters had transtibial amputations and one-quarter had transfemoral amputations. The subjects’ prosthetic experience was fairly high, with an average of 24 years of post-amputation experience.2
Study participants were asked to keep an activity diary over the course of a week in which they recorded their activity over 15-minute intervals on a four-point scale: resting (no steps taken), light (1-15 steps per minute), medium (16-40 steps per minute), and high (40+ steps per minute). In addition, a Modus Health StepWatch™ Activity Monitor (SAM) was installed on their prostheses during the same time period. Coupled with the appropriate software, the SAM meets many of the criteria outlined by the VA that utilization monitors should measure in order to be prescribed and reimbursed by the VA. More than a pedometer, the SAM also measures the number of steps per minute, allowing for a determination of cadence, cadence variability, and other performance indices.2
At the conclusion of the week, the self-reported activity diaries were compared against the objective data measured by the SAMs. The initial confluence between them appeared somewhat promising. There was strong agreement between self-reported and measured activity for 87 percent of the subjects, with only three people having a poor level of agreement.2
However, the authors elected to recalculate the agreement values using only the hours between 9 a.m. and 9 p.m., when most subjects would have been awake and more active. At this point, the numbers became less encouraging. When those hours largely devoted to rest were excluded from consideration, the number of subjects with strong agreement fell from 87 percent to only 34 percent. Additionally, the number of individuals producing poor agreement swelled to 34 percent. The study subjects with transfemoral amputations, who generally had lower activity levels, provided more accurate reports of their activity with strong agreement found among 87 percent even after the recalculation for waking hours only. Subjects with transtibial amputations were much worse in accurately reporting their activity levels, with only 24 percent demonstrating strong agreement after the recalculation and 43 percent demonstrating poor agreement.2
The measured activity levels for average daily step counts are reported in Table 1. Importantly, the authors reported the number of prosthetic steps taken by each person. As that number fails to report any steps taken with the sound limb, the values in Table 1 represent a doubling of the reported prosthetic step values, providing a reasonable approximation of daily step counts.
When examining the SAM data recorded between 9 a.m. and 9 p.m., the amount of time spent in each of the four activity levels was as follows: 62.6 percent, low activity; 33.7 percent, rest; 3.5 percent, medium activity; and 0.5 percent, high activity.
Of interest, when there was discord between reported and measured activity levels, there was not systematic bias toward either overreporting or underreporting. During the aforementioned time of day, subjects were slightly more prone to underreporting (23 percent of the time) than they were to overreporting (18 percent of the time).2
Does Capacity Correlate to Performance
A later study attempted to address the question of whether ambulation capacity, as measured by such things as the two-minute walk test (2MWT), Timed Up and Go (TUG) test, and the Locomotor Capabilities Index version 5 (LCI-5), correlates to measured performance using such metrics as SAMs and self-report instruments.3
Because only a portion of the cohort wore SAMs (n = 27), the demographics of that subcohort can only be inferred from those of the larger study sample (n = 52). Within the greater sample, the average age was 52 years among a cohort of subjects with transtibial (58 percent), transfemoral (31 percent), and bilateral transtibial amputations (11 percent) who were, on average, 13.6 years post-amputation.3

The number of steps per day was extremely variable among the group, ranging from 249 to 12,714, with an average of 4,217 (this number, reported in the study itself, reflects a doubling of the measured prosthetic strides). Average activity levels as a percentage of a 24-hour period reflect the trends of the previous study, if not the exact amounts, with low activity (13 percent of the day) more common than moderate (2.2 percent of the day) and high activity (0.8 percent of the day).3
Delving into statistics only as far as required, the correlation coefficient between SAM values and 2MWT values was high (0.747), while the coefficient between SAM values and the LCI-5 (0.640) and TUG test (0.554) were only moderate. Restated, according to this pilot study, among the three assessment measures that were examined, the 2MWT was the only significant predictor of the mean steps per day taken by subjects with lower-limb amputations.3
Transfemoral Considerations: Longitudinal Trends
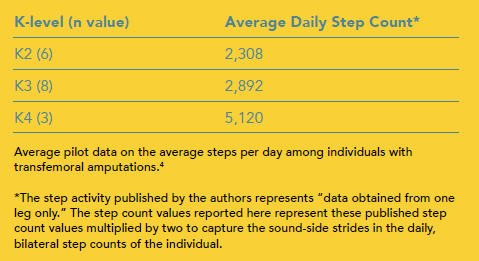
Many in the profession will recall the pioneering research of Douglas Smith, MD, and Brian Hafner, PhD, on the effects of using microprocessor knees. Originally published in 2007, this clinical trial collected SAM data on patients with transfemoral amputations over an extended time period as they used one of two available prostheses. More recently, authors have culled through that same SAM data to report upon some general observations among the cohort.4 As with the first study described, these authors reported on the step activity of the prosthetic limb only. Therefore, to the extent that step count data is reported in this article, it represents a doubling of the step count data reported in the cited reference.
The cohort under consideration consisted of 17 subjects with amputation etiologies of trauma (58 percent), malignancy (18 percent), infection (12 percent), dysfunction (6 percent), and vascular disease (6 percent), with an average of almost 18 years since their amputations.4 The number of days for which SAM data was available ranged from 145 days to 359 days, with an average of 265 days, a striking contrast to the one week of available data described in the previous two studies.4
The population averaged 3,080 steps per day over the course of the study period with some variation between subjects at different K-levels (Table 2). While the average daily step counts of K4-level ambulators (5,120) was significantly higher than those observed among K3 walkers (2,892) and K2 walkers (2,308), the difference between K2 and K3 ambulators failed to reach statistical significance, perhaps suggesting that the difference between K2 and K3 walkers is not in the number of steps taken but in the environments where they are taken and cadence during those activities.4
The longitudinal characteristics of this data allowed the authors to examine the effect of both seasonal and monthly periods on activity levels. Seasonal changes for individual subjects reflected increases and decreases as high as 50 percent.4 In general, individual subjects demonstrated a 20-25 percent decrease in activity in the winter (relative to their annual average activity) and a 10-15 percent increase in the spring.4
Monthly changes were even more pronounced. The majority of the subjects showed increased activity relative to their annual mean in the late spring and early summer months of April, May, and June, during the holiday month of December, and somewhat inexplicably, in September. By contrast, relative decreases in activity were observed during the late fall months of October and November, during the winter months of January, February, and March, and during the late summer months of July and August.4
Transtibial Considerations: Community Activity
In the last of the clinical trials described herein, the authors coupled the data obtained from SAMs with data obtained from GPS-based location recorders, allowing them to quantify not only how many steps participants took, but where they walked and how many trips they took into the community.5 As with most of the other studies considered to this point, the devices were attached to the prostheses of the study subjects for a period of seven days. The cohort consisted of 47 individuals with transtibial amputations with an average age of 60 years, for which trauma (38 percent) and peripheral vascular disease (38 percent) were the most common etiologies.5
K-levels were determined through the Amputee Mobility Predictor. While the effect of K-levels on total steps taken or average daily step counts was not reported, the authors did report the effect of K-levels on such variables as walking endurance as measured by the six-minute-walk test (6MWT), gait velocity, visits to the community, and steps taken in the community (Table 3).5
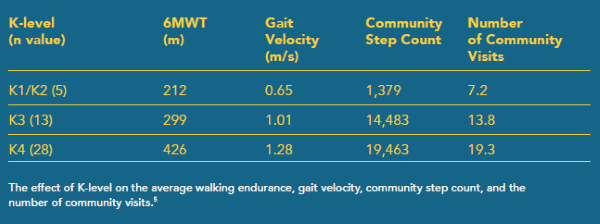
While this data does not confirm the earlier observation that K2 and K3 ambulators appear to take roughly the same amount of daily steps, it does suggest slower walking speeds and reduced community ambulation among K1 and K2 patients compared to their K3 counterparts.
The data also permits an analysis of which environments individuals with amputations take the most steps in. While the data is not broken down by K-level, it does indicate that of the 44,504 steps the average subject took over the observation week, 25,285 of those (57 percent) were in the home. This was followed by employment (21 percent), commercial centers (9 percent), and residential visits (6 percent), with recreational pursuits, social engagements, and health services rounding out the categories with comparatively lower step counts. The average employment-related step activity was certainly affected by the fact that only 16 of the 47 subjects were employed. This is further reinforced by a standard deviation of employment-related step count that was twice the average, suggesting a distribution that was largely skewed by a minority of actively employed individuals.5
The distribution of the average number of community visits by category was slightly different among those who were employed, with visits to commercial centers (5.2) being the most common, followed by employment-related community trips (3.4) and visits within one’s immediate residential community (2.9).5
Summary
As the technology related to utilization monitors becomes increasingly accessible, the prosthetic community will begin to have greater access to quantifiable measures of patient activity. As this unfolds, we will likely be surprised by what we see, with both the underreporting and overreporting associated with self-reported activity levels coming to light. In preparation for this transition, it behooves the profession to develop an awareness of the objective activity levels that have been reported in existing case studies to provide some context to the utilization numbers that we will start to encounter.
Phil Stevens, MEd, CPO, FAAOP, is in clinical practice with Hanger Clinic, Salt Lake City. He can be reached at philmstevens@hotmail.com.
References
- www.spsco.com/media/wysiwyg/product_info/Modus/Modus_VA_Memo.pdf
- Stepien, J. M., S. Cavenett, L. Taylor, and M. Crotty. 2007. Activity levels among lower-limb amputees: Self-report versus step activity monitor. Archives of Physical Medicine and Rehabilitation 88 (7):896-900.
- Parker, K., R. L. Kirby, J. Adderson, and K. Thompson. 2010. Ambulation of people with lower-limb amputations: Relationship between capacity and performance measures. Archives of Physical Medicine and Rehabilitation 91 (4):543-9.
- Halsne, E. G., M. G. Waddingham, and B. J. Hafner. 2013. Long-term activity in and among persons with transfemoral amputation. Journal of Rehabilitation Research and Development 50 (4):515-30.
- Hordacre, B., C. Barr, and M. Crotty. 2014. Use of an activity monitor and GPS device to assess community activity and participation in transtibial amputees. Sensors 14 (4):5845-59.